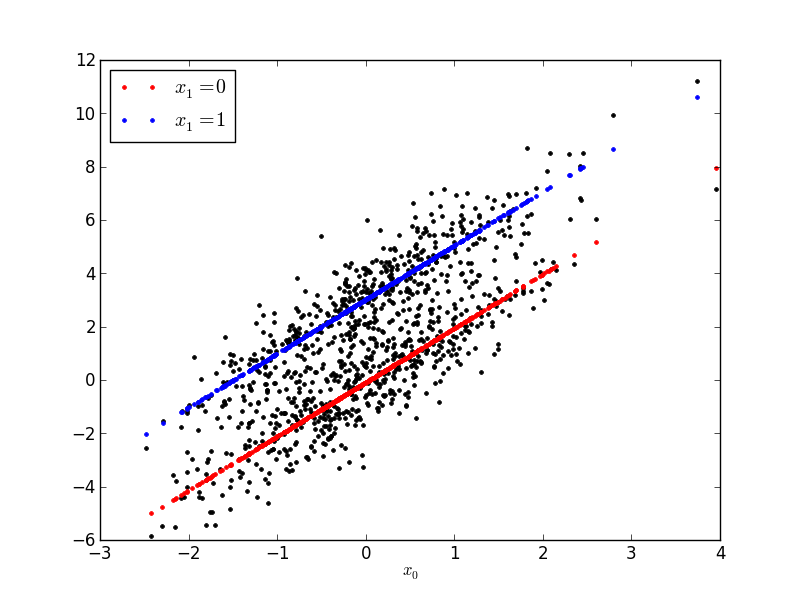
Plotting a linear function with a categorical variable
Fitting a pyearth model to a linear function shows that pyearth will automatically choose a linear basis function in some cases.
Out:
  Earth Model
-------------------------------------
Basis Function  Pruned  Coefficient
-------------------------------------
(Intercept)     No      -0.0882234
x0              No      2.02668
x1              No      3.1094
x2              Yes     None
-------------------------------------
MSE: 0.9868, GCV: 0.9988, RSQ: 0.8619, GRSQ: 0.8605
import numpy as np
import matplotlib.pyplot as plt
from pyearth import Earth

np.random.seed(1)
m = 1000
n = 5

X = np.random.normal(size=(m, n))

# Make X[:,1] binary
X[:, 1] = np.random.binomial(1, .5, size=m)

# The response is a linear function of the inputs
y = 2 * X[:, 0] + 3 * X[:, 1] + np.random.normal(size=m)

# Fit the earth model
model = Earth().fit(X, y)

# Print the model summary, showing linear terms
print(model.summary())

# Plot for both values of X[:,1]
y_hat = model.predict(X)
plt.figure()
plt.plot(X[:, 0], y, 'k.')
plt.plot(X[X[:, 1] == 0, 0], y_hat[X[:, 1] == 0], 'r.', label='$x_1 = 0$')
plt.plot(X[X[:, 1] == 1, 0], y_hat[X[:, 1] == 1], 'b.', label='$x_1 = 1$')
plt.legend(loc='best')
plt.xlabel('$x_0$')
plt.show()
Total running time of the script: (0 minutes 0.051 seconds)
Download Python source code:
plot_linear_function.py
Download IPython notebook:
plot_linear_function.ipynb