This is the gallery of examples.
Exporting a fitted Earth models as a sympy expression
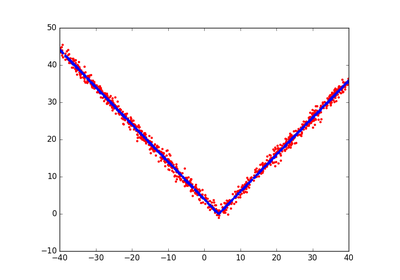
Plotting the absolute value function
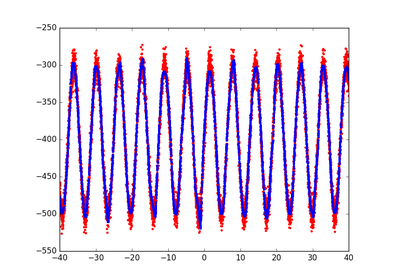
Plotting simple sine function
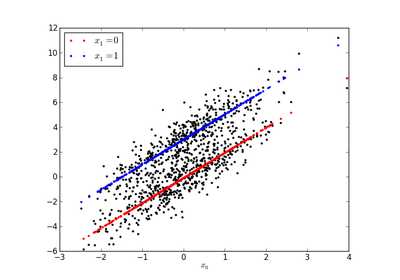
Plotting a linear function with a categorical variable
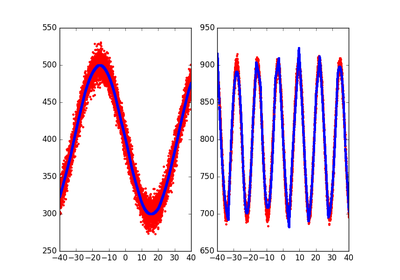
Plotting two simple sine functions
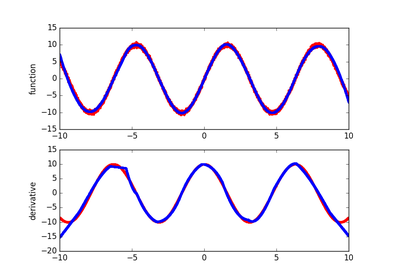
Plotting derivatives of simple sine function
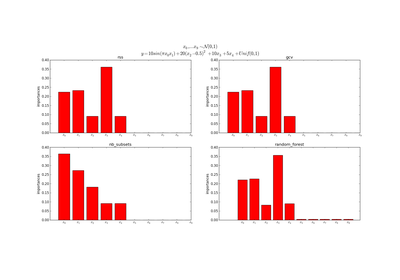
Plotting feature importance
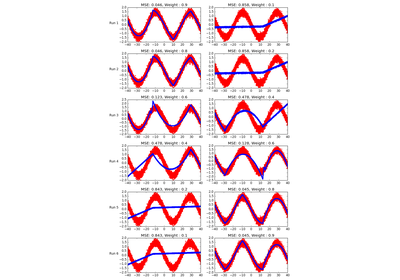
Demonstrating a use of weights in outputs with two sine functions
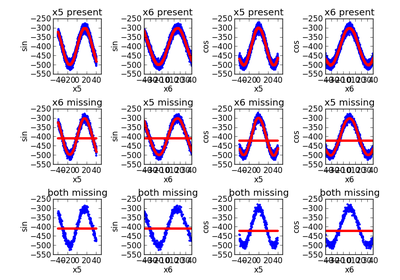
Plotting sine function with redundant predictors an missing data
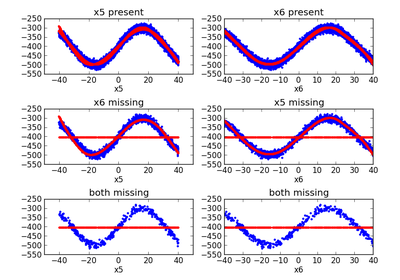
Plotting a multicolumn regression problem that includes missingness
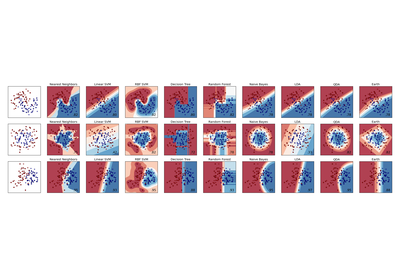
Plotting sckit-learn classifiers comparison with Earth