Note
Go to the end to download the full example code.
Fast Sparse Group Lasso in python#
Scikit-learn is missing a Sparse Group Lasso regression estimator. We show how to
implement one with skglm.
# Author: Mathurin Massias
import numpy as np
import matplotlib.pyplot as plt

from skglm.solvers import GroupBCD
from skglm.datafits import QuadraticGroup
from skglm import GeneralizedLinearEstimator
from skglm.penalties import WeightedL1GroupL2
from skglm.utils.data import make_correlated_data, grp_converter

n_features = 30
X, y, _ = make_correlated_data(
    n_samples=10, n_features=30, random_state=0)
Model creation: combination of penalty, datafit and solver.
penalty:
grp_size = 10  # take groups of 10 consecutive features
n_groups = n_features // grp_size
grp_indices, grp_ptr = grp_converter(grp_size, n_features)
n_groups = len(grp_ptr) - 1
weights_g = np.ones(n_groups, dtype=np.float64)
weights_f = 0.5 * np.ones(n_features)
penalty = WeightedL1GroupL2(
    alpha=0.5, weights_groups=weights_g,
    weights_features=weights_f, grp_indices=grp_indices, grp_ptr=grp_ptr)
datafit = QuadraticGroup(grp_ptr, grp_indices)
solver = GroupBCD(ws_strategy="fixpoint", verbose=1, fit_intercept=False, tol=1e-10)

model = GeneralizedLinearEstimator(datafit, penalty, solver=solver)
Train the model
clf = GeneralizedLinearEstimator(datafit, penalty, solver)
clf.fit(X, y)
Iteration 1: 2.9165123923, stopping crit: 6.04e-01
Iteration 2: 2.0255867844, stopping crit: 1.59e-01
Iteration 3: 1.6882399219, stopping crit: 1.45e-02
Iteration 4: 1.6804572089, stopping crit: 7.12e-05
Iteration 5: 1.6804570719, stopping crit: 5.84e-06
Iteration 6: 1.6804570709, stopping crit: 2.04e-07
Iteration 7: 1.6804570709, stopping crit: 4.81e-09
Iteration 8: 1.6804570709, stopping crit: 5.76e-13
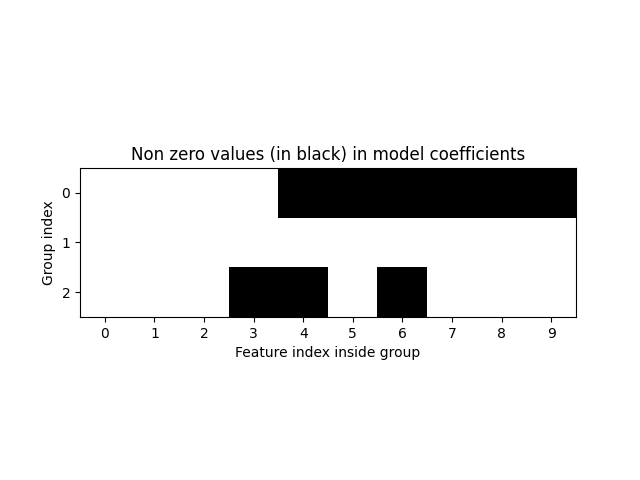
Some groups are fully 0, and inside non zero groups, some values are 0 too
plt.imshow(clf.coef_.reshape(-1, grp_size) != 0, cmap='Greys')
plt.title("Non zero values (in black) in model coefficients")
plt.ylabel('Group index')
plt.xlabel('Feature index inside group')
plt.xticks(np.arange(grp_size))
plt.yticks(np.arange(n_groups));

([<matplotlib.axis.YTick object at 0x7f4144c28760>, <matplotlib.axis.YTick object at 0x7f4144e09600>, <matplotlib.axis.YTick object at 0x7f4144bcd150>], [Text(0, 0, '0'), Text(0, 1, '1'), Text(0, 2, '2')])
Total running time of the script: (0 minutes 6.831 seconds)