Note
Go to the end to download the full example code.
Group Logistic regression in python#
Scikit-learn is missing a Group Logistic regression estimator. We show how to implement
one with skglm.
# Author: Mathurin Massias

import numpy as np

from skglm import GeneralizedLinearEstimator
from skglm.datafits import LogisticGroup
from skglm.penalties import WeightedGroupL2
from skglm.solvers import GroupProxNewton
from skglm.utils.data import make_correlated_data, grp_converter

import matplotlib.pyplot as plt

n_features = 30
X, y, _ = make_correlated_data(
    n_samples=10, n_features=30, random_state=0)
y = np.sign(y)
Classifier creation: combination of penalty, datafit and solver.
grp_size = 3  # groups are made of groups of 3 consecutive features
n_groups = n_features // grp_size
grp_indices, grp_ptr = grp_converter(grp_size, n_features=n_features)
alpha = 0.01
weights = np.ones(n_groups)
penalty = WeightedGroupL2(alpha, weights, grp_ptr, grp_indices)
datafit = LogisticGroup(grp_ptr, grp_indices)
solver = GroupProxNewton(verbose=2)
Train the model
Iteration 1: 0.6931471806, stopping crit: 5.93e-01
PN iteration 1: 0.1828438632, stopping crit in: 1.48e-01
Early exit
Iteration 2: 0.1828438632, stopping crit: 1.48e-01
PN iteration 1: 0.1122823448, stopping crit in: 4.83e-02
PN iteration 2: 0.0920730009, stopping crit in: 1.56e-02
Early exit
Iteration 3: 0.0920730009, stopping crit: 1.56e-02
PN iteration 1: 0.0849753666, stopping crit in: 5.98e-03
PN iteration 2: 0.0799335206, stopping crit in: 1.74e-03
Early exit
Iteration 4: 0.0799335206, stopping crit: 1.74e-03
PN iteration 1: 0.0794189783, stopping crit in: 2.10e-04
Early exit
Iteration 5: 0.0794189783, stopping crit: 2.10e-04
PN iteration 1: 0.0794086709, stopping crit in: 6.08e-05
Early exit
Iteration 6: 0.0794086709, stopping crit: 6.08e-05
Fit check that groups are either all 0 or all non zero
print(clf.coef_.reshape(-1, grp_size))
[[ 0.          0.          0.        ]
 [-1.09358498 -0.88830458 -0.77241873]
 [-1.68346202 -1.26329232 -1.04960499]
 [-0.16612516  0.0249733  -0.03614162]
 [ 0.          0.          0.        ]
 [-0.01611123 -0.01500223 -0.00637489]
 [-0.9086726  -0.95978761 -0.49653568]
 [ 0.          0.          0.        ]
 [ 0.          0.          0.        ]
 [ 0.57186315 -0.24696147  0.16123249]]
Visualise group-level sparsity
coef_by_group = clf.coef_.reshape(-1, grp_size)
group_norms = np.linalg.norm(coef_by_group, axis=1)

plt.figure(figsize=(8, 4))
plt.bar(np.arange(n_groups), group_norms)
plt.xlabel("Group index")
plt.ylabel("L2 norm of coefficients")
plt.title("Group Sparsity Pattern")
plt.tight_layout()
plt.show()
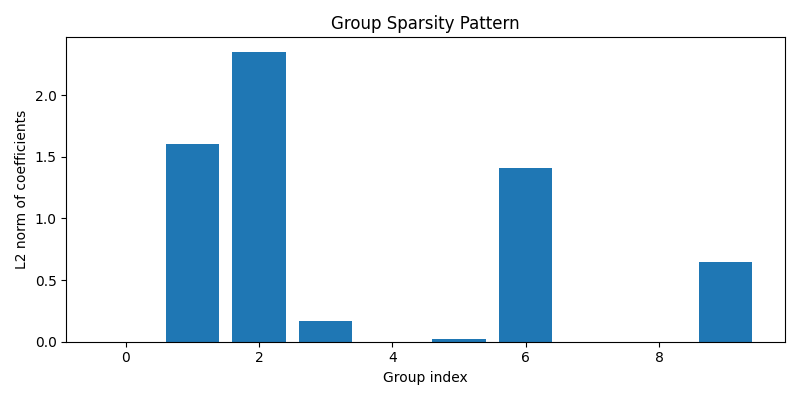
This plot shows the L2 norm of the coefficients for each group. Groups with a zero norm have been set inactive by the model, illustrating how Group Logistic Regression enforces sparsity at the group level. (Note: This example uses a tiny synthetic dataset, so the pattern has limited interpretability.)
Total running time of the script: (0 minutes 14.131 seconds)