Plotting feature importance
A simple example showing how to compute and display feature importances, it is also compared with the feature importances obtained using random forests.
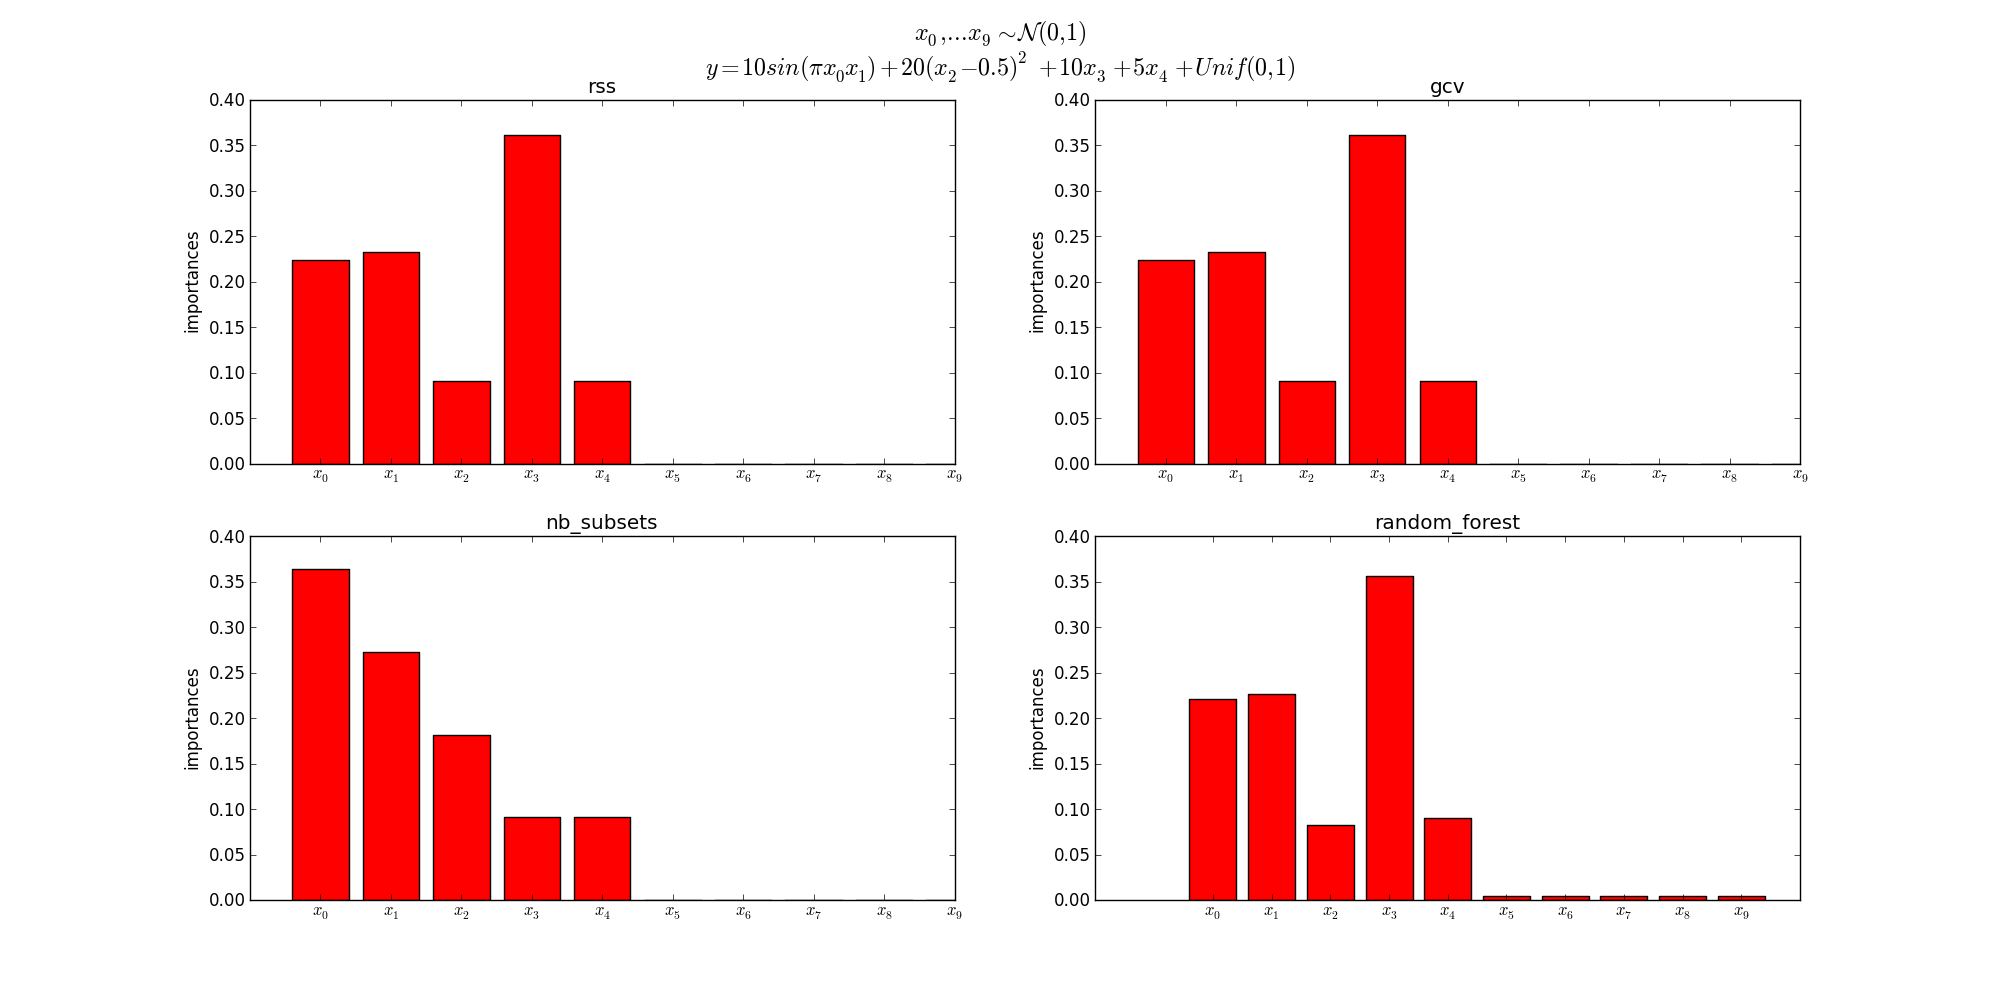
Feature importance is a measure of the effect of the features on the outputs. For each feature, the values go from 0 to 1 where a higher the value means that the feature will have a higher effect on the outputs.
Currently three criteria are supported : ‘gcv’, ‘rss’ and ‘nb_subsets’. See [1], section 12.3 for more information about the criteria.
| [1] | http://www.milbo.org/doc/earth-notes.pdf |
Out:
  Beginning forward pass
-----------------------------------------------------------------
iter  parent  var  knot  mse        terms  gcv     rsq    grsq
-----------------------------------------------------------------
0     -       -    -     24.101072  1      24.106  0.000  0.000
1     0       3    -1    15.626212  2      15.637  0.352  0.351
2     0       1    2446  10.884011  4      10.903  0.548  0.548
3     0       0    43    6.386236  6      6.404  0.735  0.734
4     0       2    3272  4.226153  8      4.242  0.825  0.824
5     0       4    -1    2.136919  9      2.146  0.911  0.911
6     4       1    9815  1.113502  11     1.119  0.954  0.954
---------------------------------------------------------------
Stopping Condition 0: Reached maximum number of terms
Beginning pruning pass
--------------------------------------------
iter  bf  terms  mse   gcv    rsq    grsq
--------------------------------------------
0     -   11     1.11  1.119  0.954  0.954
1     2   10     1.40  1.405  0.942  0.942
2     10  9      1.63  1.635  0.932  0.932
3     4   8      1.68  1.684  0.930  0.930
4     9   7      2.16  2.168  0.910  0.910
5     6   6      3.84  3.851  0.841  0.840
6     7   5      4.29  4.297  0.822  0.822
7     8   4      6.41  6.425  0.734  0.733
8     5   3      10.89  10.907  0.548  0.548
9     3   2      15.63  15.637  0.352  0.351
10    1   1      24.10  24.106  -0.000  -0.000
------------------------------------------------
Selected iteration: 0
Forward Pass
-----------------------------------------------------------------
iter  parent  var  knot  mse        terms  gcv     rsq    grsq
-----------------------------------------------------------------
0     -       -    -     24.101072  1      24.106  0.000  0.000
1     0       3    -1    15.626212  2      15.637  0.352  0.351
2     0       1    2446  10.884011  4      10.903  0.548  0.548
3     0       0    43    6.386236   6      6.404   0.735  0.734
4     0       2    3272  4.226153   8      4.242   0.825  0.824
5     0       4    -1    2.136919   9      2.146   0.911  0.911
6     4       1    9815  1.113502   11     1.119   0.954  0.954
-----------------------------------------------------------------
Stopping Condition 0: Reached maximum number of terms

Pruning Pass
------------------------------------------------
iter  bf  terms  mse    gcv     rsq     grsq
------------------------------------------------
0     -   11     1.11   1.119   0.954   0.954
1     2   10     1.40   1.405   0.942   0.942
2     10  9      1.63   1.635   0.932   0.932
3     4   8      1.68   1.684   0.930   0.930
4     9   7      2.16   2.168   0.910   0.910
5     6   6      3.84   3.851   0.841   0.840
6     7   5      4.29   4.297   0.822   0.822
7     8   4      6.41   6.425   0.734   0.733
8     5   3      10.89  10.907  0.548   0.548
9     3   2      15.63  15.637  0.352   0.351
10    1   1      24.10  24.106  -0.000  -0.000
------------------------------------------------
Selected iteration: 0

Earth Model
----------------------------------------------------
Basis Function                 Pruned  Coefficient
----------------------------------------------------
(Intercept)                    No      7.68887
x3                             No      10.0005
h(x1-0.525027)                 No      5.34483
h(0.525027-x1)                 No      -9.90971
h(x0-0.563426)                 No      10.4923
h(0.563426-x0)                 No      -12.0495
h(x2-0.496723)                 No      9.90482
h(0.496723-x2)                 No      10.1095
x4                             No      5.00753
h(x1-0.496528)*h(x0-0.563426)  No      -56.5856
h(0.496528-x1)*h(x0-0.563426)  No      -36.1381
----------------------------------------------------
MSE: 1.1135, GCV: 1.1193, RSQ: 0.9538, GRSQ: 0.9536
       nb_subsets    gcv    rss
x3     0.09          0.36   0.36
x1     0.27          0.23   0.23
x0     0.36          0.22   0.22
x2     0.18          0.09   0.09
x4     0.09          0.09   0.09
x9     0.00          0.00   0.00
x8     0.00          0.00   0.00
x7     0.00          0.00   0.00
x6     0.00          0.00   0.00
x5     0.00          0.00   0.00
import numpy
import matplotlib.pyplot as plt

from sklearn.ensemble import RandomForestRegressor
from pyearth import Earth

# Create some fake data
numpy.random.seed(2)
m = 10000
n = 10

X = numpy.random.uniform(size=(m, n))
y = (10 * numpy.sin(numpy.pi * X[:, 0] * X[:, 1]) +
     20 * (X[:, 2] - 0.5) ** 2 +
     10 * X[:, 3] +
     5 * X[:, 4] + numpy.random.uniform(size=m))
# Fit an Earth model
criteria = ('rss', 'gcv', 'nb_subsets')
model = Earth(max_degree=3,
              max_terms=10,
              minspan_alpha=.5,
              feature_importance_type=criteria,
              verbose=True)
model.fit(X, y)
rf = RandomForestRegressor()
rf.fit(X, y)
# Print the model
print(model.trace())
print(model.summary())
print(model.summary_feature_importances(sort_by='gcv'))

# Plot the feature importances
importances = model.feature_importances_
importances['random_forest'] = rf.feature_importances_
criteria = criteria + ('random_forest',)
idx = 1

fig = plt.figure(figsize=(20, 10))
labels = ['$x_{}$'.format(i) for i in range(n)]
for crit in criteria:
    plt.subplot(2, 2, idx)
    plt.bar(numpy.arange(len(labels)),
            importances[crit],
            align='center',
            color='red')
    plt.xticks(numpy.arange(len(labels)), labels)
    plt.title(crit)
    plt.ylabel('importances')
    idx += 1
title = '$x_0,...x_9 \sim \mathcal{N}(0, 1)$\n$y= 10sin(\pi x_{0}x_{1}) + 20(x_2 - 0.5)^2 + 10x_3 + 5x_4 + Unif(0, 1)$'
fig.suptitle(title, fontsize="x-large")
plt.show()
Total running time of the script: (0 minutes 1.583 seconds)
Download Python source code:
plot_feature_importance.py
Download IPython notebook:
plot_feature_importance.ipynb