
Note
Go to the end to download the full example code.
DenMune: Basic Clustering of Non-Convex Shapes#
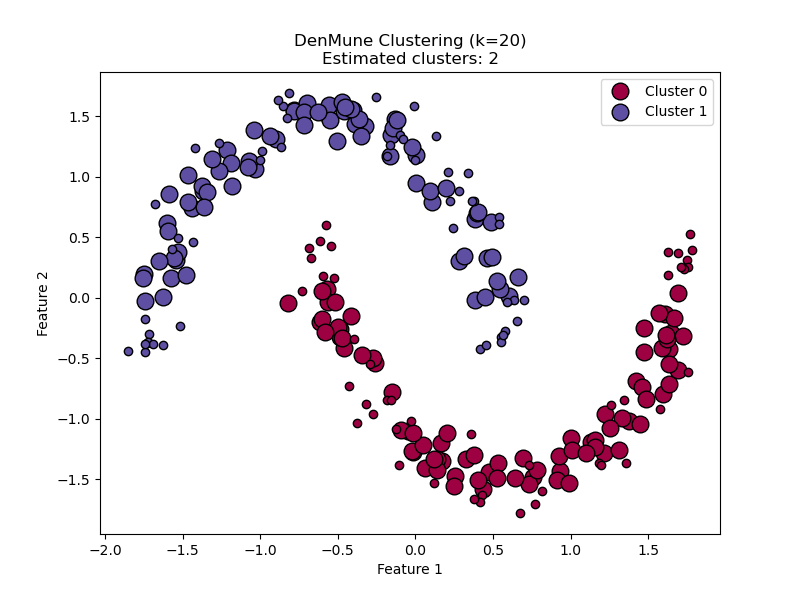
This example demonstrates the primary use case of the DenMune algorithm: identifying clusters of arbitrary shapes.
We generate a ‘moons’ dataset, which is a classic benchmark for clustering algorithms that struggle with non-convex data, such as K-Means.
The plot shows that DenMune, similar to DBSCAN, can successfully separate the two moon-shaped clusters. It also identifies “strong” points (core samples) which form the skeleton of the clusters, and “weak” points (boundary samples) that are attached to them.
import matplotlib.pyplot as plt
import numpy as np
from sklearn.datasets import make_moons
from sklearn.preprocessing import StandardScaler

from denmune_skl import DenMune
Generate and prepare the data#
X, y = make_moons(n_samples=250, noise=0.07, random_state=42)
X = StandardScaler().fit_transform(X)
Fit the DenMune model#
We choose a k_nearest value that is appropriate for the density of the dataset.
Since the data is already 2D, we set reduce_dims=False.
model = DenMune(k_nearest=20, reduce_dims=False, random_state=42)
model.fit(X)
labels = model.labels_
n_clusters = model.n_clusters_

print(f"Estimated number of clusters: {n_clusters}")
Estimated number of clusters: 2
Visualize the clustering results#
We create a visualization that distinguishes between core points (strong points) and boundary points (weak points).
core_samples_mask = np.zeros_like(labels, dtype=bool)
core_samples_mask[model.core_sample_indices_] = True
unique_labels = set(labels)

fig, ax = plt.subplots(figsize=(8, 6))
colors = [plt.cm.Spectral(each) for each in np.linspace(0, 1, len(unique_labels))]

for k, col in zip(unique_labels, colors):
    if k == -1:
        # Black used for noise.
        col = [0, 0, 0, 1]

    class_member_mask = labels == k

    # Plot core samples with larger markers
    xy = X[class_member_mask & core_samples_mask]
    ax.plot(
        xy[:, 0],
        xy[:, 1],
        "o",
        markerfacecolor=tuple(col),
        markeredgecolor="k",
        markersize=12,
        label=f"Cluster {k}",
    )

    # Plot non-core samples with smaller markers
    xy = X[class_member_mask & ~core_samples_mask]
    ax.plot(
        xy[:, 0],
        xy[:, 1],
        "o",
        markerfacecolor=tuple(col),
        markeredgecolor="k",
        markersize=6,
    )

ax.set_title(
    f"DenMune Clustering (k={model.k_nearest})\nEstimated clusters: {n_clusters}"
)
ax.set_xlabel("Feature 1")
ax.set_ylabel("Feature 2")
ax.legend()
plt.show()
Total running time of the script: (0 minutes 0.193 seconds)