Note
Go to the end to download the full example code
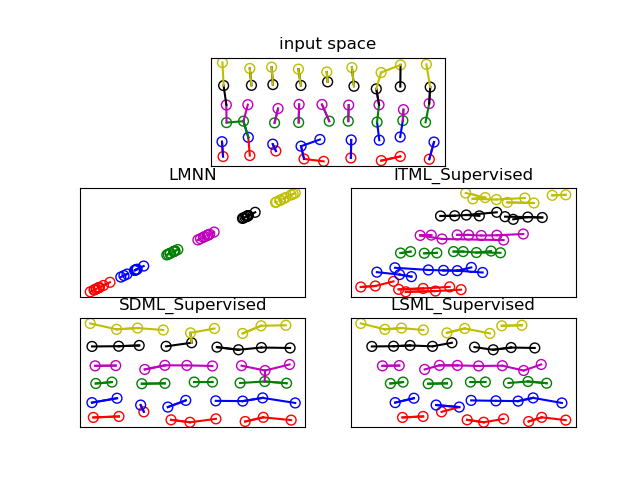
Sandwich demo
Sandwich demo based on code from http://nbviewer.ipython.org/6576096
Note
In order to show the charts of the examples you need a graphical
matplotlib backend installed. For intance, use pip install pyqt5
to get Qt graphical interface or use your favorite one.
import numpy as np
from matplotlib import pyplot as plt
from sklearn.metrics import pairwise_distances
from sklearn.neighbors import NearestNeighbors

from metric_learn import (LMNN, ITML_Supervised, LSML_Supervised,
                          SDML_Supervised)


def sandwich_demo():
  x, y = sandwich_data()
  knn = nearest_neighbors(x, k=2)
  ax = plt.subplot(3, 1, 1)  # take the whole top row
  plot_sandwich_data(x, y, ax)
  plot_neighborhood_graph(x, knn, y, ax)
  ax.set_title('input space')
  ax.set_aspect('equal')
  ax.set_xticks([])
  ax.set_yticks([])

  mls = [
      LMNN(),
      ITML_Supervised(n_constraints=200),
      SDML_Supervised(n_constraints=200, balance_param=0.001),
      LSML_Supervised(n_constraints=200),
  ]

  for ax_num, ml in enumerate(mls, start=3):
    ml.fit(x, y)
    tx = ml.transform(x)
    ml_knn = nearest_neighbors(tx, k=2)
    ax = plt.subplot(3, 2, ax_num)
    plot_sandwich_data(tx, y, axis=ax)
    plot_neighborhood_graph(tx, ml_knn, y, axis=ax)
    ax.set_title(ml.__class__.__name__)
    ax.set_xticks([])
    ax.set_yticks([])
  plt.show()


# TODO: use this somewhere
def visualize_class_separation(X, labels):
  _, (ax1, ax2) = plt.subplots(ncols=2)
  label_order = np.argsort(labels)
  ax1.imshow(pairwise_distances(X[label_order]), interpolation='nearest')
  ax2.imshow(pairwise_distances(labels[label_order, None]),
             interpolation='nearest')


def nearest_neighbors(X, k=5):
  knn = NearestNeighbors(n_neighbors=k)
  knn.fit(X)
  return knn.kneighbors(X, return_distance=False)


def sandwich_data():
  # number of distinct classes
  num_classes = 6
  # number of points per class
  num_points = 9
  # distance between layers, the points of each class are in a layer
  dist = 0.7

  data = np.zeros((num_classes, num_points, 2), dtype=float)
  labels = np.zeros((num_classes, num_points), dtype=int)

  x_centers = np.arange(num_points, dtype=float) - num_points / 2
  y_centers = dist * (np.arange(num_classes, dtype=float) - num_classes / 2)
  for i, yc in enumerate(y_centers):
    for k, xc in enumerate(x_centers):
      data[i, k, 0] = np.random.normal(xc, 0.1)
      data[i, k, 1] = np.random.normal(yc, 0.1)
    labels[i, :] = i
  return data.reshape((-1, 2)), labels.ravel()


def plot_sandwich_data(x, y, axis=plt, colors='rbgmky'):
  for idx, val in enumerate(np.unique(y)):
    xi = x[y == val]
    axis.scatter(*xi.T, s=50, facecolors='none', edgecolors=colors[idx])


def plot_neighborhood_graph(x, nn, y, axis=plt, colors='rbgmky'):
  for i, a in enumerate(x):
    b = x[nn[i, 1]]
    axis.plot((a[0], b[0]), (a[1], b[1]), colors[y[i]])


if __name__ == '__main__':
  sandwich_demo()
/Users/william.vezelhes/metric-learn/metric_learn/constraints.py:224: UserWarning: Only generated 199 positive constraints (requested 200)
  warnings.warn("Only generated %d %s constraints (requested %d)" % (
/Users/william.vezelhes/miniconda3/envs/docenvbis/lib/python3.11/site-packages/sklearn/covariance/_graph_lasso.py:329: FutureWarning: The cov_init parameter is deprecated in 1.3 and will be removed in 1.5. It does not have any effect.
  warnings.warn(
Total running time of the script: (0 minutes 3.314 seconds)