Note
Go to the end to download the full example code.
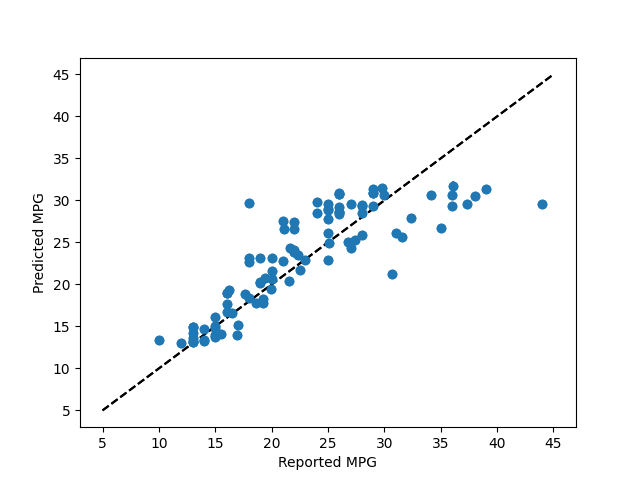
Plotting Bagging Regression Error Bars
This example demonstrates using forestci to calculate the error bars of
the predictions of a sklearn.ensemble.BaggingRegressor object.
The data used here are scikit-learn’s bundled diabetes regression dataset, which avoids requiring a network connection when building the documentation.
# Regression Forest Example
import numpy as np
from matplotlib import pyplot as plt
from sklearn.datasets import load_diabetes
from sklearn.ensemble import BaggingRegressor
from sklearn.svm import SVR
import sklearn.model_selection as xval
import forestci as fci

# Load a regression dataset bundled with scikit-learn
diabetes_X, diabetes_y = load_diabetes(return_X_y=True)

# Split the data into training and test sets
X_train, X_test, y_train, y_test = xval.train_test_split(
    diabetes_X, diabetes_y, test_size=0.25, random_state=42
)

# Create a bagged SVR model
n_estimators = 1000
bagger = BaggingRegressor(
    estimator=SVR(), n_estimators=n_estimators, random_state=42
)
bagger.fit(X_train, y_train)
y_pred = bagger.predict(X_test)
target_range = [diabetes_y.min(), diabetes_y.max()]

# Plot predictions without error bars
plt.scatter(y_test, y_pred)
plt.plot(target_range, target_range, "k--")
plt.xlabel("Observed disease progression")
plt.ylabel("Predicted disease progression")
plt.show()

# Calculate the variance
variance = fci.random_forest_error(bagger, X_train.shape, X_test)

# Plot error bars for predictions using unbiased variance
plt.errorbar(y_test, y_pred, yerr=np.sqrt(variance), fmt="o")
plt.plot(target_range, target_range, "k--")
plt.xlabel("Observed disease progression")
plt.ylabel("Predicted disease progression")
plt.show()
Total running time of the script: (0 minutes 4.967 seconds)