Note
Go to the end to download the full example code.
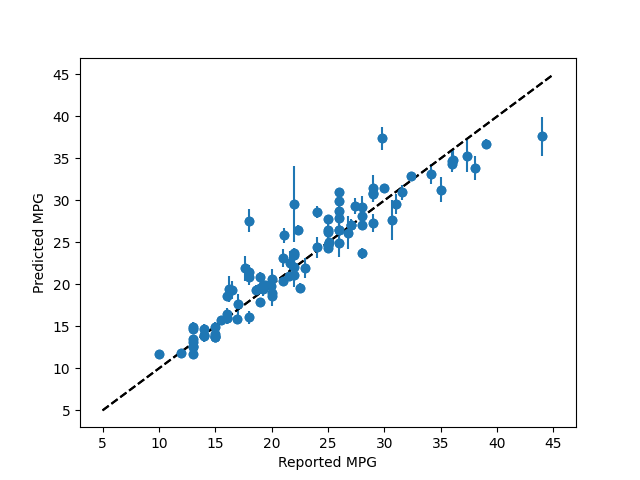
Plotting Regression Forest Error Bars
This example demonstrates using forestci to calculate the error bars of
the predictions of a sklearn.ensemble.RandomForestRegressor object.
The data used here are scikit-learn’s bundled diabetes regression dataset, which avoids requiring a network connection when building the documentation.
/opt/hostedtoolcache/Python/3.10.20/x64/lib/python3.10/site-packages/forestci/calibration.py:100: UserWarning: Fitting the empirical bayes prior failed with message Desired error not necessarily achieved due to precision loss..
  warnings.warn("Fitting the empirical bayes prior failed with message %s." % res.message)
# Regression Forest Example
import numpy as np
from matplotlib import pyplot as plt
from sklearn.datasets import load_diabetes
from sklearn.ensemble import RandomForestRegressor
import sklearn.model_selection as xval
import forestci as fci

# Load a regression dataset bundled with scikit-learn
diabetes_X, diabetes_y = load_diabetes(return_X_y=True)

# Split the data into training and test sets
X_train, X_test, y_train, y_test = xval.train_test_split(
    diabetes_X,
    diabetes_y,
    test_size=0.25,
    random_state=42,
)

# Create RandomForestRegressor
n_trees = 2000
forest = RandomForestRegressor(n_estimators=n_trees, random_state=42)
forest.fit(X_train, y_train)
y_pred = forest.predict(X_test)
target_range = [diabetes_y.min(), diabetes_y.max()]

# Plot predictions without error bars
plt.scatter(y_test, y_pred)
plt.plot(target_range, target_range, 'k--')
plt.xlabel('Observed disease progression')
plt.ylabel('Predicted disease progression')
plt.show()

# Calculate the variance
variance = fci.random_forest_error(forest, X_train.shape, X_test)

# Plot error bars for predictions using unbiased variance
plt.errorbar(y_test, y_pred, yerr=np.sqrt(variance), fmt='o')
plt.plot(target_range, target_range, 'k--')
plt.xlabel('Observed disease progression')
plt.ylabel('Predicted disease progression')
plt.show()
Total running time of the script: (0 minutes 4.899 seconds)