Note
Go to the end to download the full example code.
Plotting Template Classifier#
An example plot of skltemplate.template.TemplateClassifier
Train our classifier on very simple dataset
from skltemplate import TemplateClassifier

X = [[0, 0], [1, 1]]
y = [0, 1]
clf = TemplateClassifier().fit(X, y)
Create a test dataset
import numpy as np

rng = np.random.RandomState(13)
X_test = rng.rand(500, 2)
Use scikit-learn to display the decision boundary
from sklearn.inspection import DecisionBoundaryDisplay

disp = DecisionBoundaryDisplay.from_estimator(clf, X_test)
disp.ax_.scatter(
    X_test[:, 0],
    X_test[:, 1],
    c=clf.predict(X_test),
    s=20,
    edgecolors="k",
    linewidths=0.5,
)
disp.ax_.set(
    xlabel="Feature 1",
    ylabel="Feature 2",
    title="Template Classifier Decision Boundary",
)
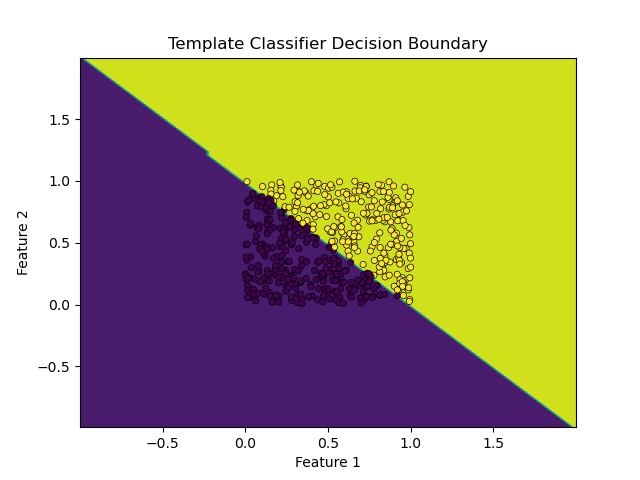
[Text(0.5, 23.52222222222222, 'Feature 1'), Text(30.972222222222214, 0.5, 'Feature 2'), Text(0.5, 1.0, 'Template Classifier Decision Boundary')]
Total running time of the script: (0 minutes 0.147 seconds)